
Mouse ELISA Kits
Mouse H3(Histone H3) ELISA Kit
Product No
FY-EM5403Sample Type
Tissue homogenate and Cell lysateAssay Time
3.5HPurchase details
 Contact supplier to negotiate price details
100% Quality Assurance
Fast Shipping
 DataSheet
Product Details
Product Name in English:
Mouse H3(Histone H3) ELISA Kit
Species:
Mouse
Alternative Name:
HIST1H3A, H3FA, HIST1H3B, H3FL, HIST1H3C, H3FC, HIST1H3D, H3FB, HIST1H3E, H3FD, HIST1H3F, H3FI, HIST1H3G, H3FH, HIST1H3H, H3FK, HIST1H3I, H3FF, HIST1H3J, H3FJ, Histone H3.1, Histone H3/a, Histone H3/b, Histone H3/c, Histone H3/d, Histone H3
Uniport ID:
P68433(Histone H3.1)&P84228(Histone H3.2)&P84244(Histone H3.3)
Assay Type:
Sandwich
Standard:
10ng/mL
Sensitivity:
0.1 ng/mL
Detection Range:
0.16-10ng/mL
Assay Time:
3.5H
Sample Type:
Tissue homogenate and Cell lysate
Research:
Metabolic pathway;Tumor immunity;Endocrinology;Cardiovascular biology;Neuro science;
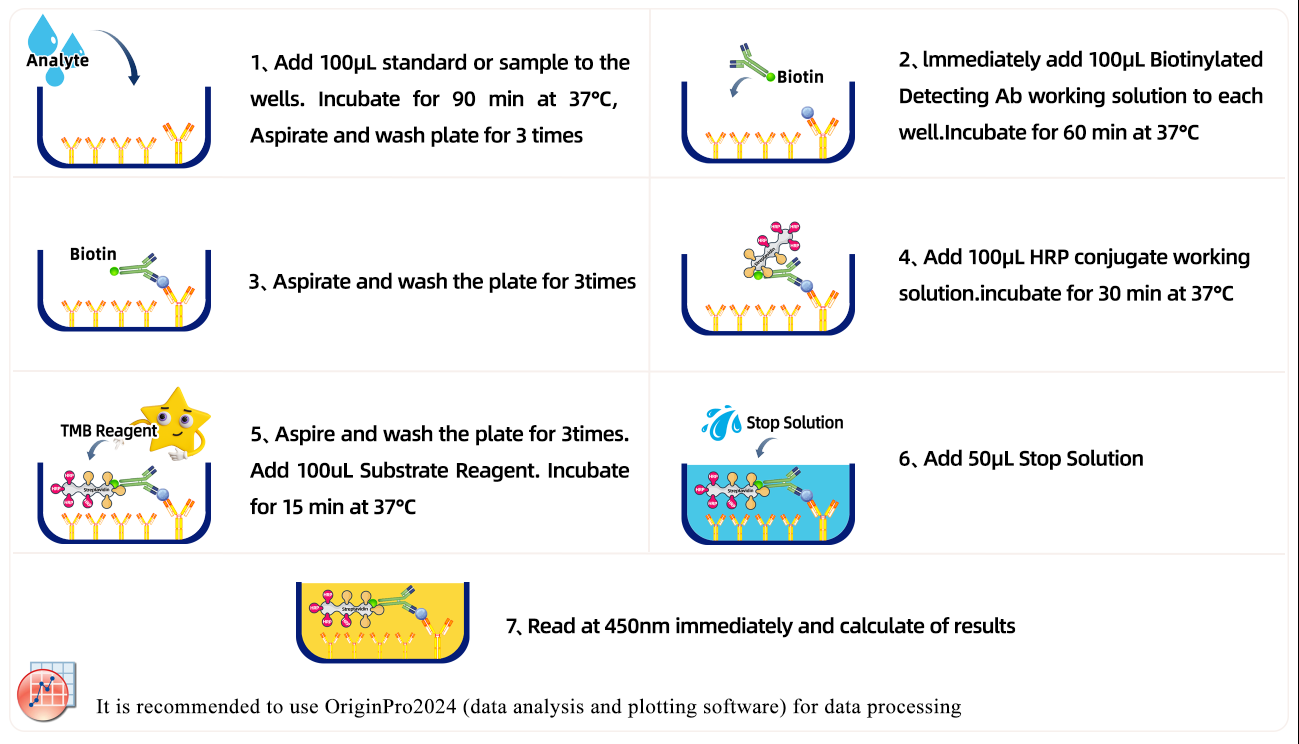
Test Principle:
The test principle applied in this kit is Sandwich enzyme immunoassay. The microtiter plate provided in this kit has been pre-coated with an antibody specific to H3. Standards or samples are added to the appropriate microtiter plate wells then with a biotin-conjugated antibody specific to H3. Next, Avidin conjugated to Horseradish Peroxidase (HRP) is added to each microplate well and incubated. After TMB substrate solution is added, only those wells that contain H3, biotin-conjugated antibody and enzyme-conjugated Avidin will exhibit a change in color. The enzyme-substrate reaction is terminated by the addition of stop solution and the color change is measured spectrophotometrically at a wavelength of 450nm ± 10nm. The concentration of H3 in the samples is then determined by comparing the OD of the samples to the standard curve.
Technical Data
As the OD values of the standard curve may vary according to the conditions of the actual assay performance (e.g. operator, pipetting technique, washing technique or temperature effects), the operator should establish a standard curve for each test. Typical standard curve and data is provided below for reference only.
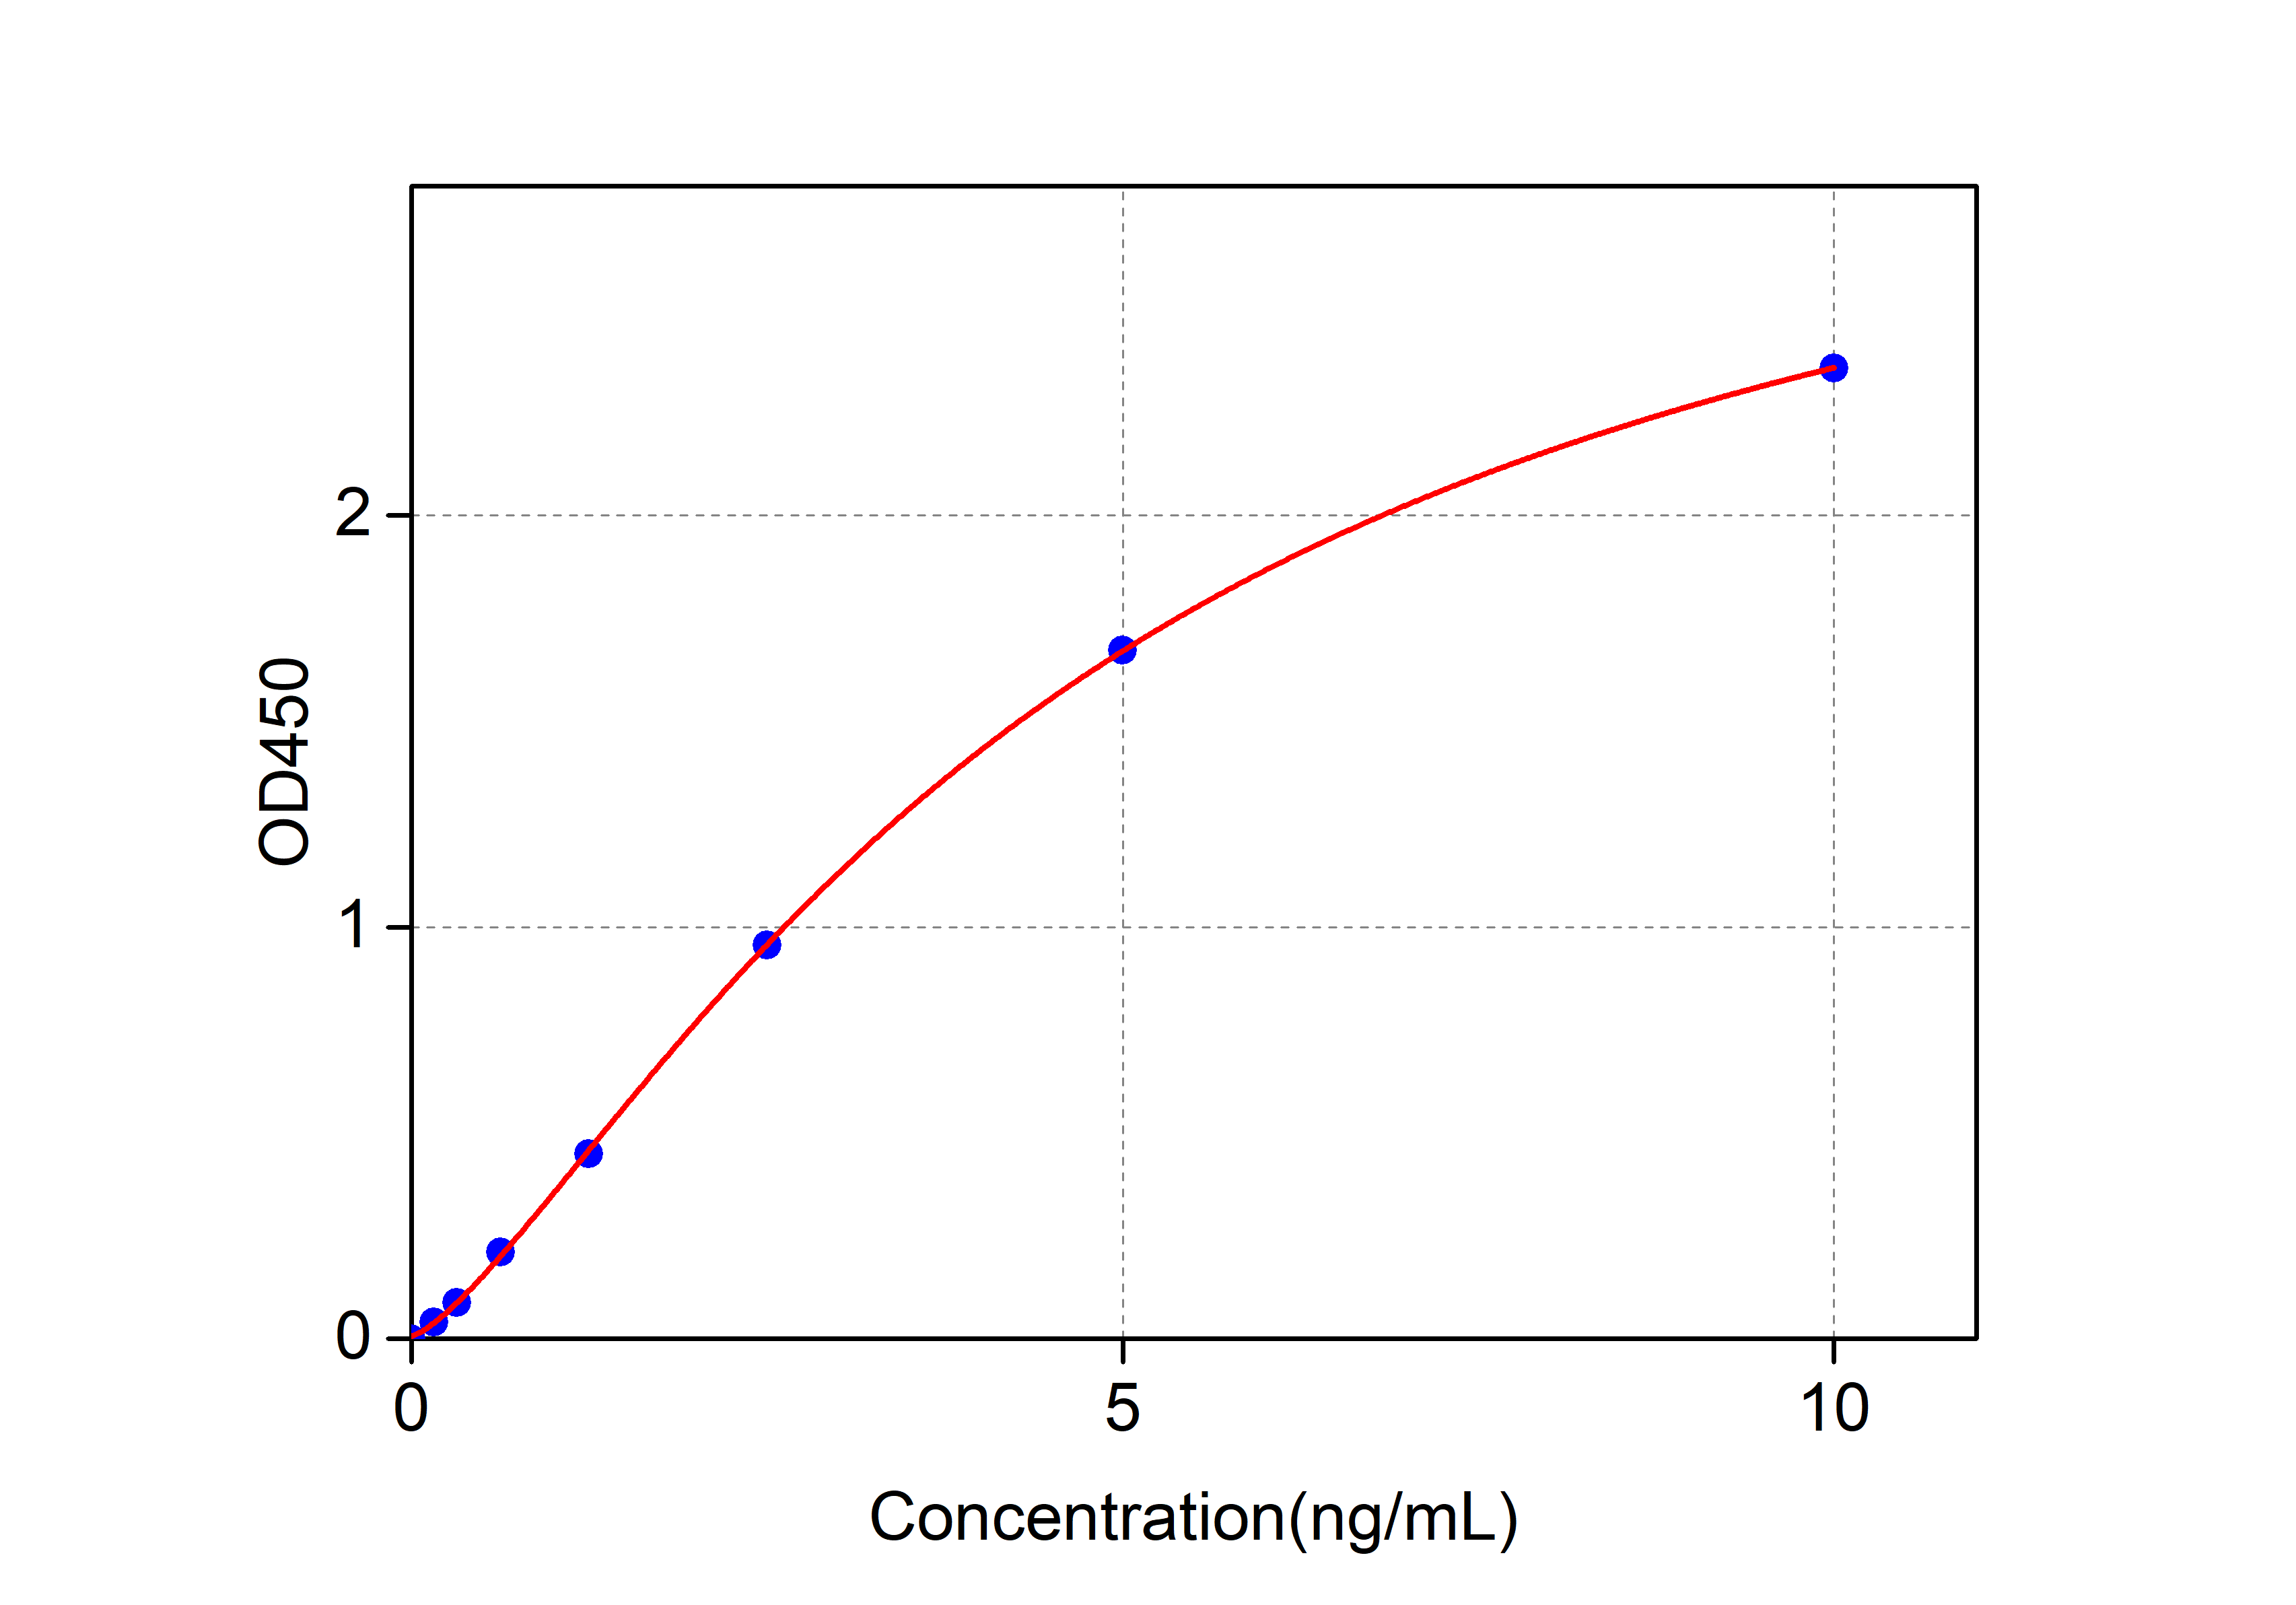
| Concentration | OD1 | OD2 | Average OD | Corrected |
|---|---|---|---|---|
| 10 | 2.411 | 2.424 | 2.418 | 2.358 |
| 5 | 1.726 | 1.729 | 1.728 | 1.673 |
| 2.5 | 1.01 | 1.019 | 1.015 | 0.957 |
| 1.25 | 0.503 | 0.504 | 0.504 | 0.45 |
| 0.63 | 0.264 | 0.264 | 0.264 | 0.211 |
| 0.32 | 0.141 | 0.141 | 0.141 | 0.088 |
| 0.16 | 0.094 | 0.094 | 0.094 | 0.041 |
| 0 | 0.053 | 0.053 | 0.053 | 0 |
Precision
Intra-assay Precision (Precision within an assay): 3 samples with low, mid range and high level were tested 20 times on one plate, respectively. Inter-assay Precision (Precision between assays): 3 samples with low, mid range and high level were tested on 3 different plates, 20 replicates in each plate, respectively.
| Item | Intra-assay Precision | Intra-assay Precision |
|---|---|---|
| Sample | 3 | 3 |
| Replicate | 9 | 18 |
| CV(%) | 5 | 8 |
Rate of recovery
The recovery of spiked at three different levels in samples throughout the range of the assay was evaluated in various matrices.
| Sample Type | Range(%) | Average Recovery(%) |
|---|---|---|
| Serum (n=8) | 92-107 | 99 |
| EDTA plasma (n=8) | 93-107 | 100 |
| Cell culture media (n=8) | 87-99 | 93 |
Linear
Samples were spiked with high concentrations of target proteins and diluted with Reference Standard & Sample Diluent to produce samples with values within the range of the assay.
| Serum (n=5) | EDTA plasma (n=5) | Cell culture media (n=5) | ||
|---|---|---|---|---|
| 1:2 | Range (%) | 86-96 | 86-94 | 92-105 |
| Average (%) | 94 | 90 | 97 | |
| 1:4 | Range (%) | 85-97 | 86-94 | 95-103 |
| Average (%) | 86 | 89 | 103 | |
| 1:8 | Range (%) | 89-101 | 93-102 | 87-98 |
| Average (%) | 90 | 98 | 95 | |
| 1:16 | Range (%) | 85-97 | 87-96 | 85-92 |
| Average (%) | 86 | 94 | 90 |
Assay Procedures
Related literature
Related Products
Social Media