
EasyPro Series ELISA Kits
EasyPro Rat Receptor Ⅱ for the Fc Region of Immunoglobulin E(FcεRⅡ/CD23)ELISA Kit
Product No
FY-ER1018SSample Type
Serum, Plasma, Tissue homogenate and Other biological samples;Sample Volume=50uLAssay Time
1.5HPurchase details
 Contact supplier to negotiate price details
100% Quality Assurance
Fast Shipping
 DataSheet
Product Details
Product Name in English:
EasyPro Rat Receptor Ⅱ for the Fc Region of Immunoglobulin E(FcεRⅡ/CD23)ELISA Kit
Species:
Rat
Alternative Name:
FCER2, BLAST-2, CD23A, CLEC4J, FCE2, IGEBF, Fc epsilon RII
Assay Type:
Sandwich
Standard:
2000pg/mL
Sensitivity:
18.75 pg/mL
Detection Range:
31.25-2000pg/mL
Assay Time:
1.5H
Sample Type:
Serum, Plasma, Tissue homogenate and Other biological samples;Sample Volume=50uL
Research:
Immune molecule;
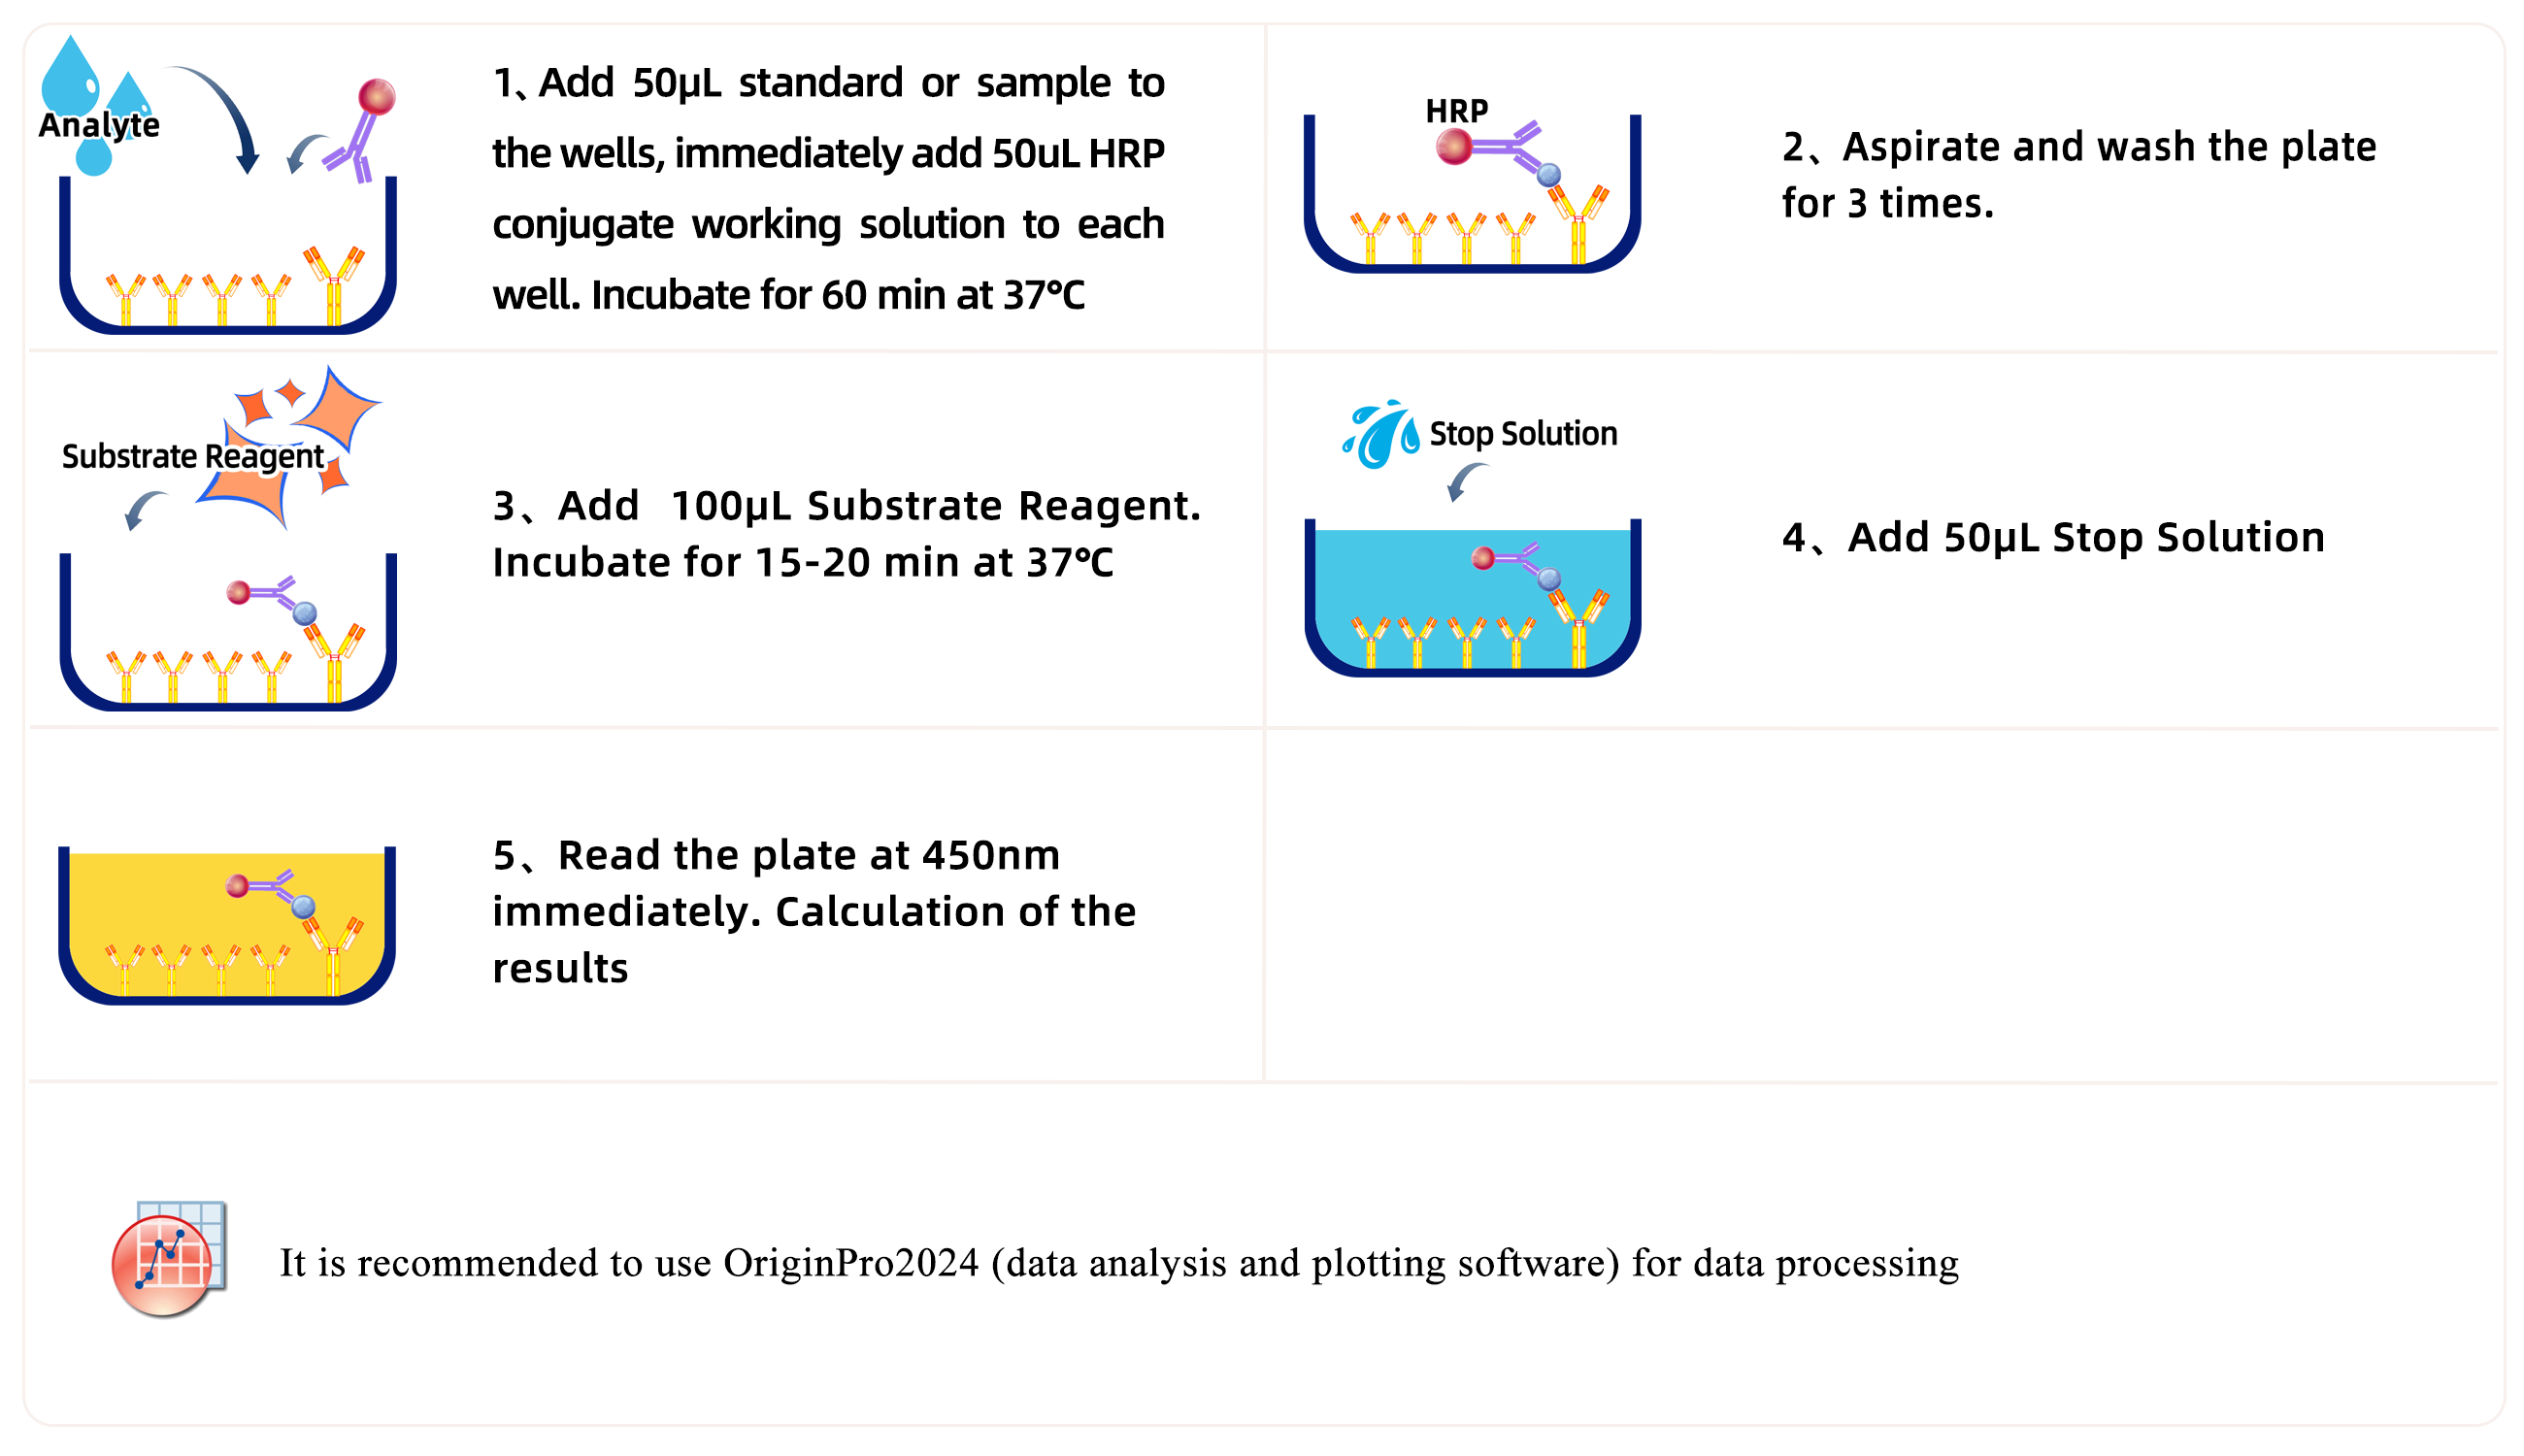
Test Principle:
This ELISA kit uses the Sandwich-ELISA principle. The micro ELISA plate provided in this kit has been pre-coated with an antibody specific to FcεRⅡ/CD23. Samples (or Standards) and and Horseradish Peroxidase (HRP) linked antibody specific for FcεRⅡ/CD23 are added to the micro ELISA plate wells. FcεRⅡ/CD23 in samples (or standards) combines with the coated antibody and HRP linked detection antibody special to FcεRⅡ/CD23. Excess conjugate and unbound sample or standard are washed from the plate. The enzyme-substrate reaction is terminated by the addition of stop solution and the color turns yellow. The optical density (OD) is measured spectrophotometrically at a wavelength of 450 nm. The OD value is proportional to the concentration of FcεRⅡ/CD23. You can calculate the concentration of FcεRⅡ/CD23 in the samples by comparing the OD of the samples to the standard curve.
Technical Data
As the OD values of the standard curve may vary according to the conditions of the actual assay performance (e.g. operator, pipetting technique, washing technique or temperature effects), the operator should establish a standard curve for each test. Typical standard curve and data is provided below for reference only.
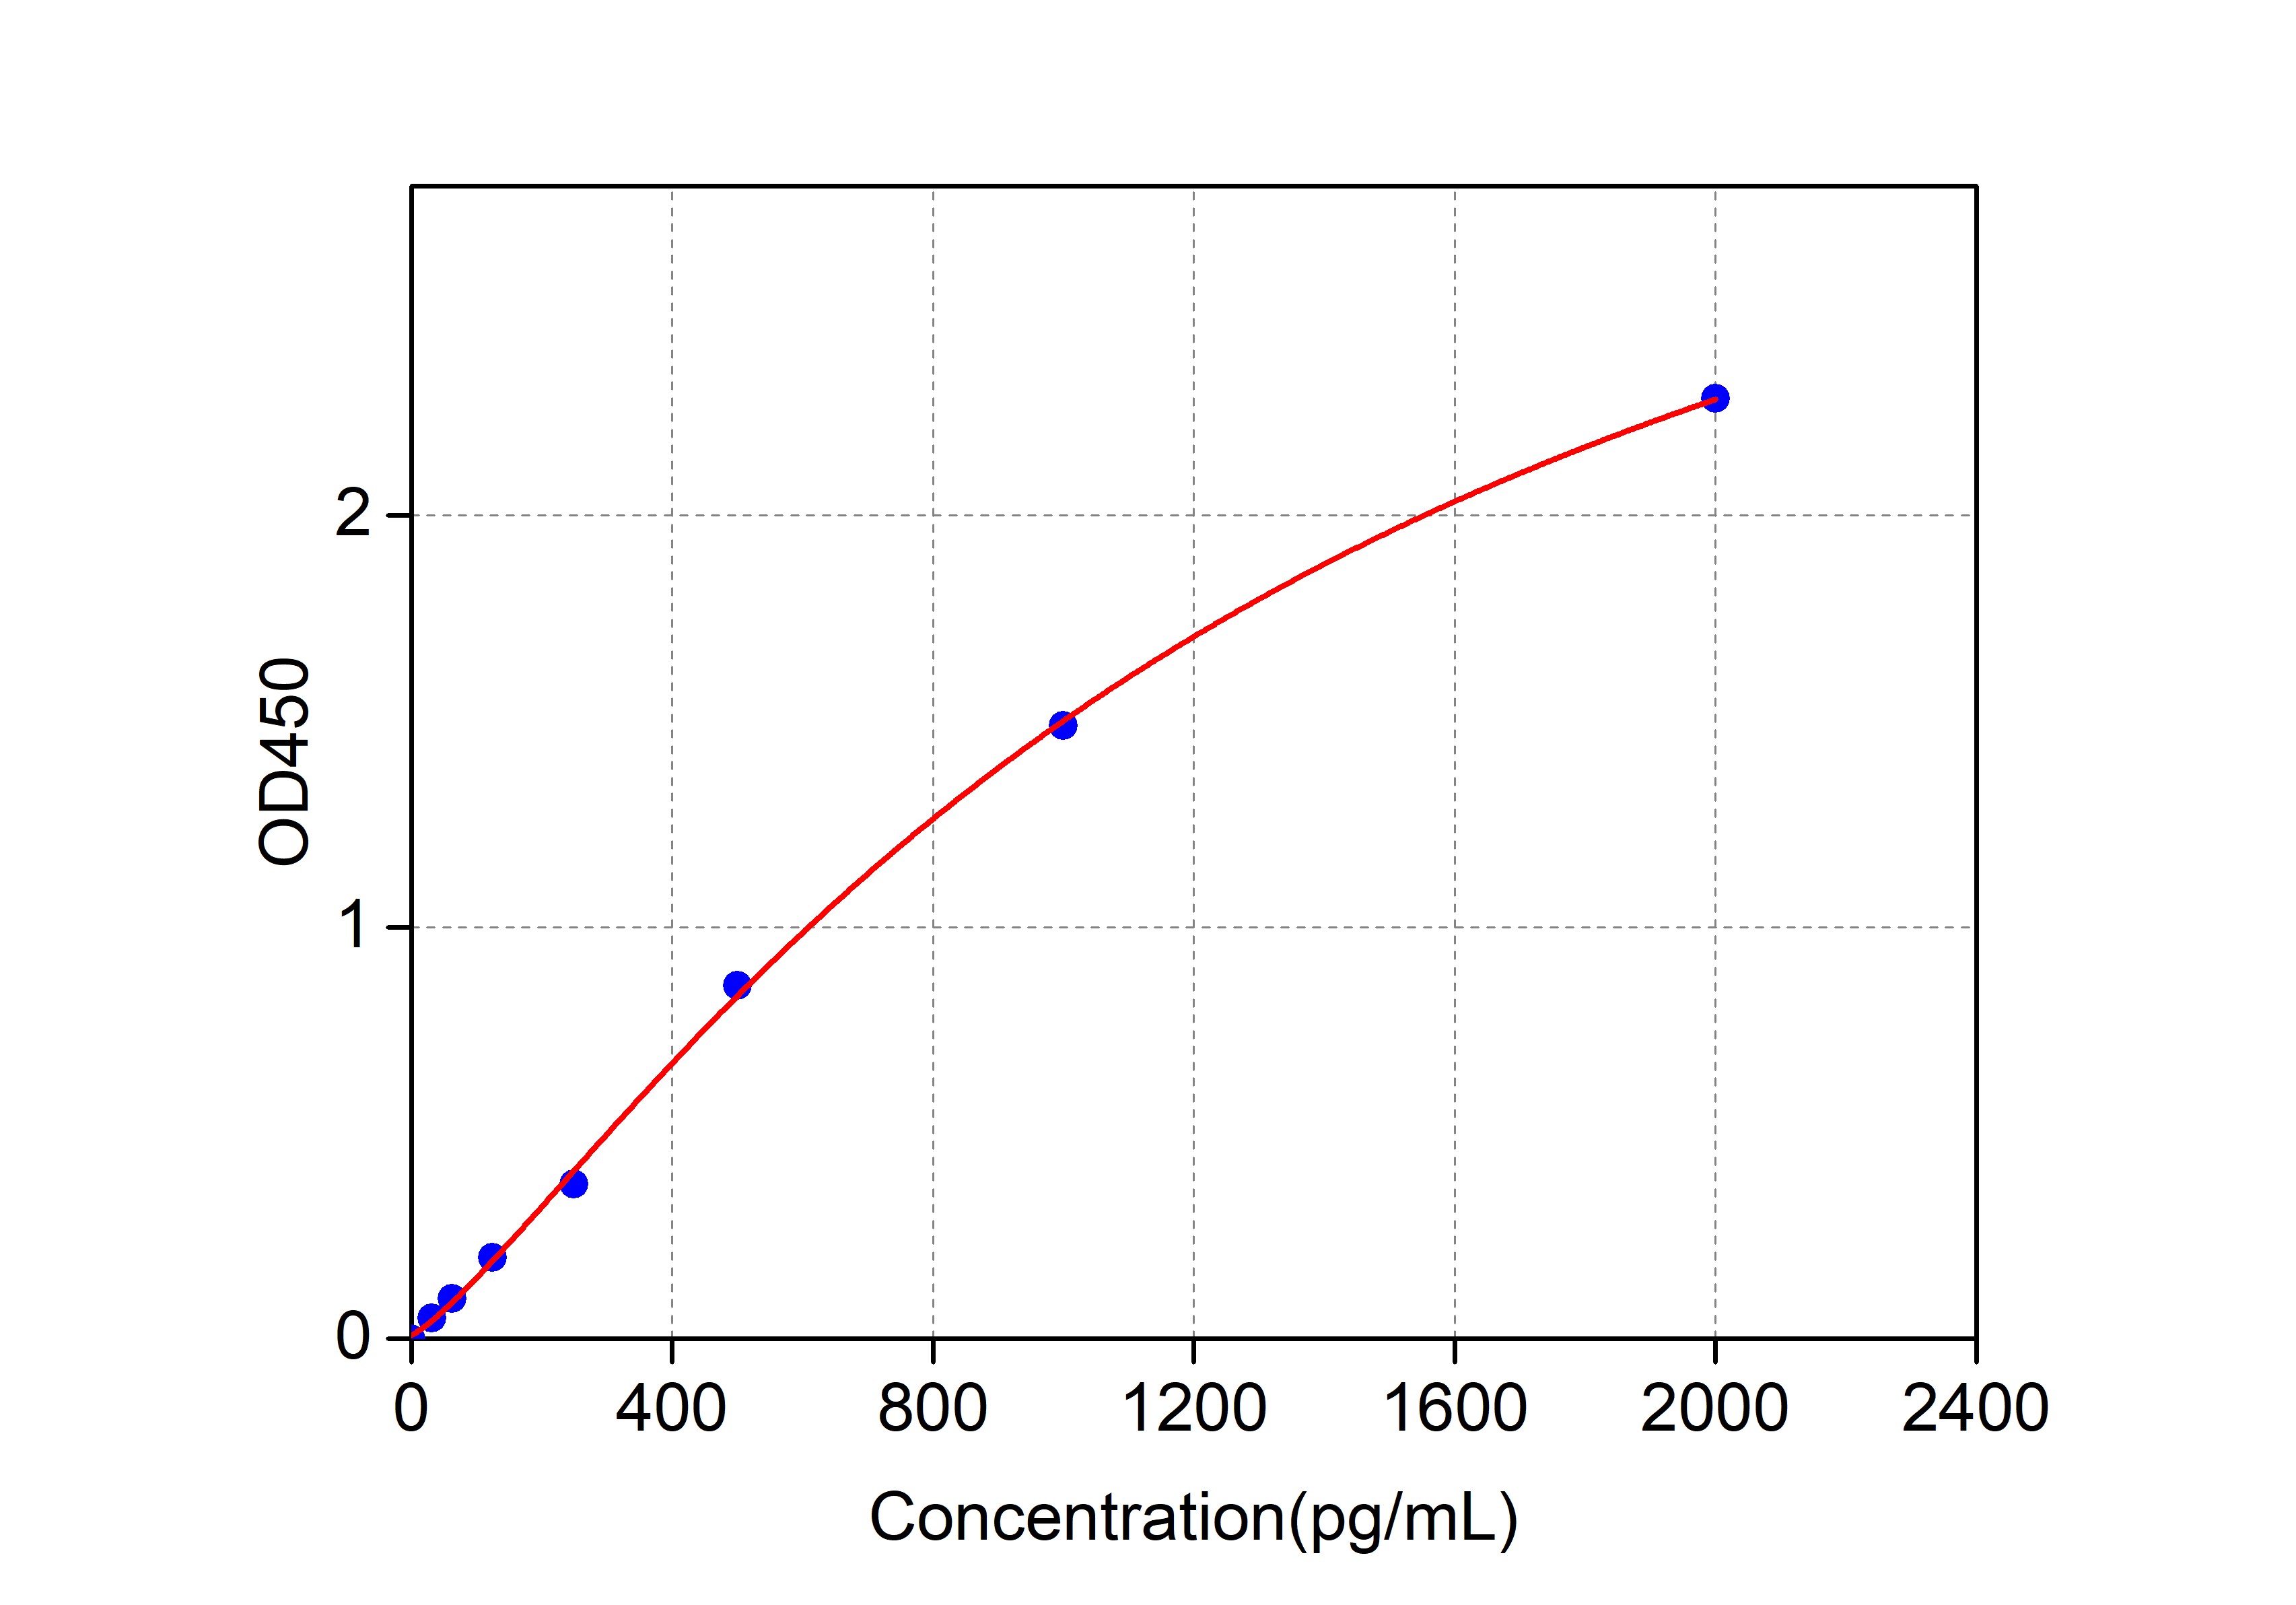
| Concentration | OD1 | OD2 | Average OD | Corrected |
|---|---|---|---|---|
| 2000 | 2.318 | 2.364 | 2.341 | 2.307 |
| 1000 | 1.524 | 1.537 | 1.531 | 1.497 |
| 500 | 0.893 | 0.901 | 0.897 | 0.863 |
| 250 | 0.41 | 0.417 | 0.414 | 0.38 |
| 125 | 0.231 | 0.235 | 0.233 | 0.199 |
| 62.5 | 0.131 | 0.133 | 0.132 | 0.098 |
| 31.25 | 0.084 | 0.085 | 0.085 | 0.051 |
| 0 | 0.034 | 0.034 | 0.034 | 0 |
Precision
Intra-assay Precision (Precision within an assay): 3 samples with low, mid range and high level were tested 20 times on one plate, respectively. Inter-assay Precision (Precision between assays): 3 samples with low, mid range and high level were tested on 3 different plates, 20 replicates in each plate, respectively.
| Item | Intra-assay Precision | Intra-assay Precision |
|---|---|---|
| Sample | 3 | 3 |
| Replicate | 9 | 18 |
| CV(%) | 5 | 8 |
Rate of recovery
The recovery of spiked at three different levels in samples throughout the range of the assay was evaluated in various matrices.
| Sample Type | Range(%) | Average Recovery(%) |
|---|---|---|
| Serum (n=8) | 87-99 | 93 |
| EDTA plasma (n=8) | 81-95 | 88 |
| Cell culture media (n=8) | 80-95 | 87 |
Linear
Samples were spiked with high concentrations of target proteins and diluted with Reference Standard & Sample Diluent to produce samples with values within the range of the assay.
| Serum (n=5) | EDTA plasma (n=5) | Cell culture media (n=5) | ||
|---|---|---|---|---|
| 1:2 | Range (%) | 86-94 | 82-95 | 83-97 |
| Average (%) | 87 | 91 | 94 | |
| 1:4 | Range (%) | 91-105 | 83-96 | 84-99 |
| Average (%) | 95 | 84 | 91 | |
| 1:8 | Range (%) | 87-99 | 88-95 | 95-102 |
| Average (%) | 98 | 93 | 97 | |
| 1:16 | Range (%) | 95-100 | 96-102 | 88-103 |
| Average (%) | 98 | 99 | 95 |
Assay Procedures
Related literature
Related Products
Social Media