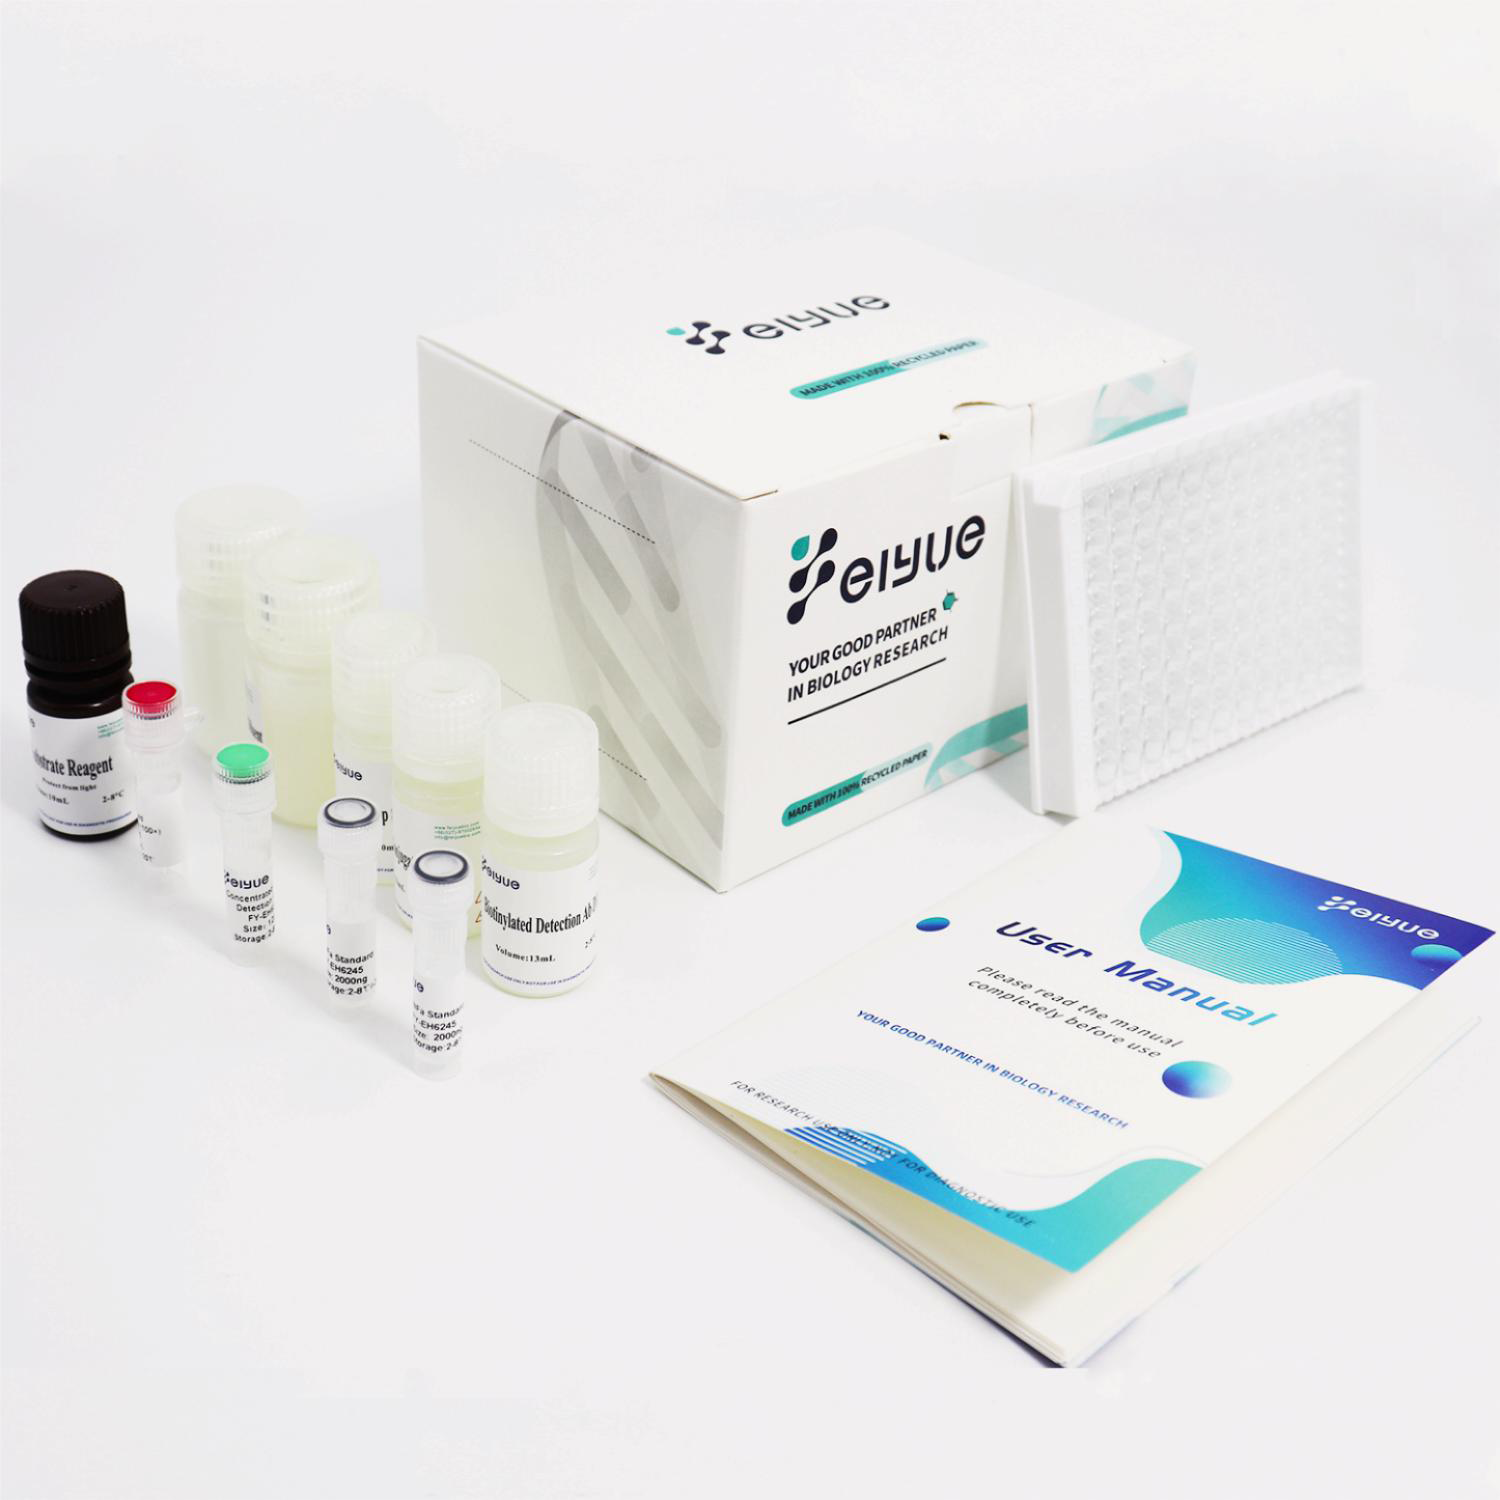
小鼠γ干扰素诱导单核细胞因子(MIγ/CXCL9)酶联免疫吸附测定试剂盒
复制
货号
FY-EM4469样本类型
Serum, Plasma, Tissue homogenate and Other biological samples检测时间
3.5H采购详情
 Contact supplier to negotiate price details
 100% Quality Assurance
 Fast Shipping

产品详情
英文名称:
Mouse MIγ/CXCL9(Monocyte Interferon Gamma Inducing Factor) ELISA Kit
种属:
Mouse
别称:
Chemokine(C-X-C motif) ligand 9,CXCL9, Monokine induced by gamma interferon,MIG,CMK, Humig, SCYB9, crg-1
Uniport ID:
P18340
检测方法:
Sandwich
标准品:
1000pg/mL
灵敏度:
9.38 pg/mL
检测范围:
15.63-1000pg/mL
反应时间:
3.5H
样品类型:
Serum, Plasma, Tissue homogenate and Other biological samples
研究领域:
Tumor immunity;Infection immunity;Cardiovascular biology;Rheumatology;
测试原理:
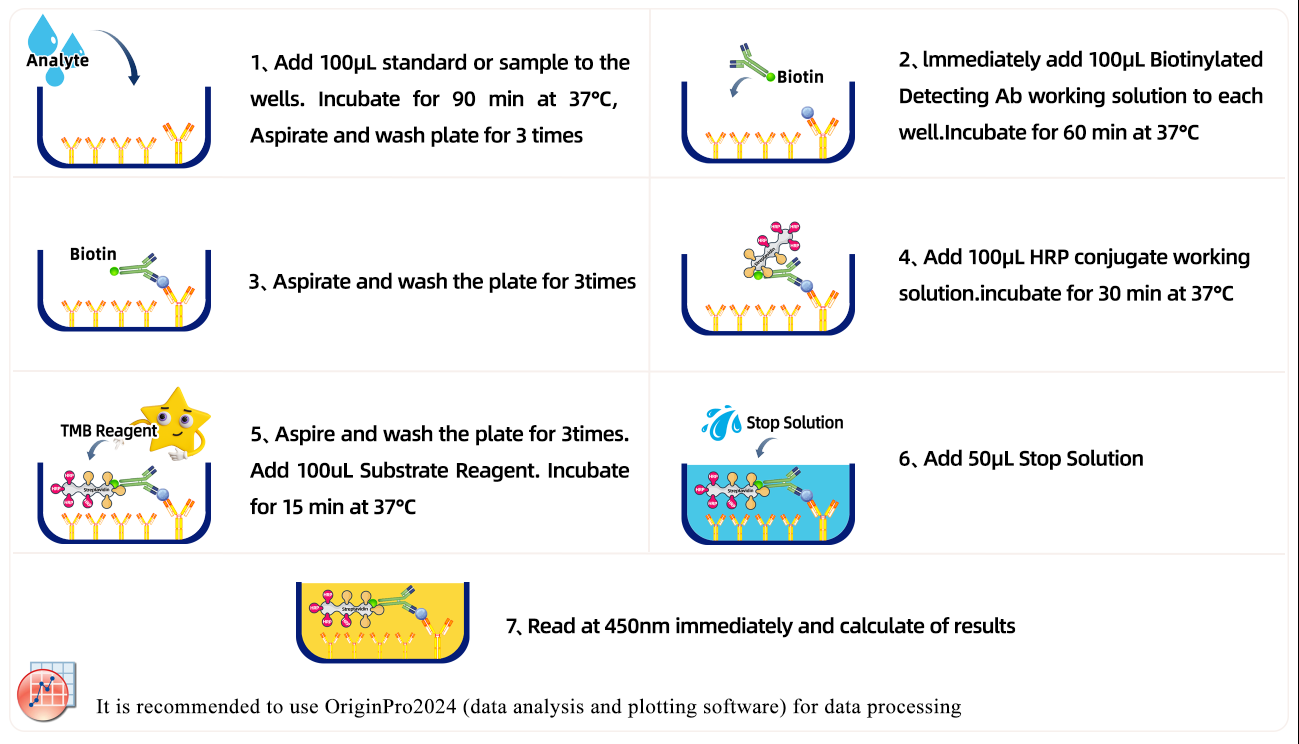
The test principle applied in this kit is Sandwich enzyme immunoassay. The microtiter plate provided in this kit has been pre-coated with an antibody specific to MIγ/CXCL9. Standards or samples are added to the appropriate microtiter plate wells then with a biotin-conjugated antibody specific to MIγ/CXCL9. Next, Avidin conjugated to Horseradish Peroxidase (HRP) is added to each microplate well and incubated. After TMB substrate solution is added, only those wells that contain MIγ/CXCL9, biotin-conjugated antibody and enzyme-conjugated Avidin will exhibit a change in color. The enzyme-substrate reaction is terminated by the addition of stop solution and the color change is measured spectrophotometrically at a wavelength of 450nm ± 10nm. The concentration of MIγ/CXCL9 in the samples is then determined by comparing the OD of the samples to the standard curve.
技术数据
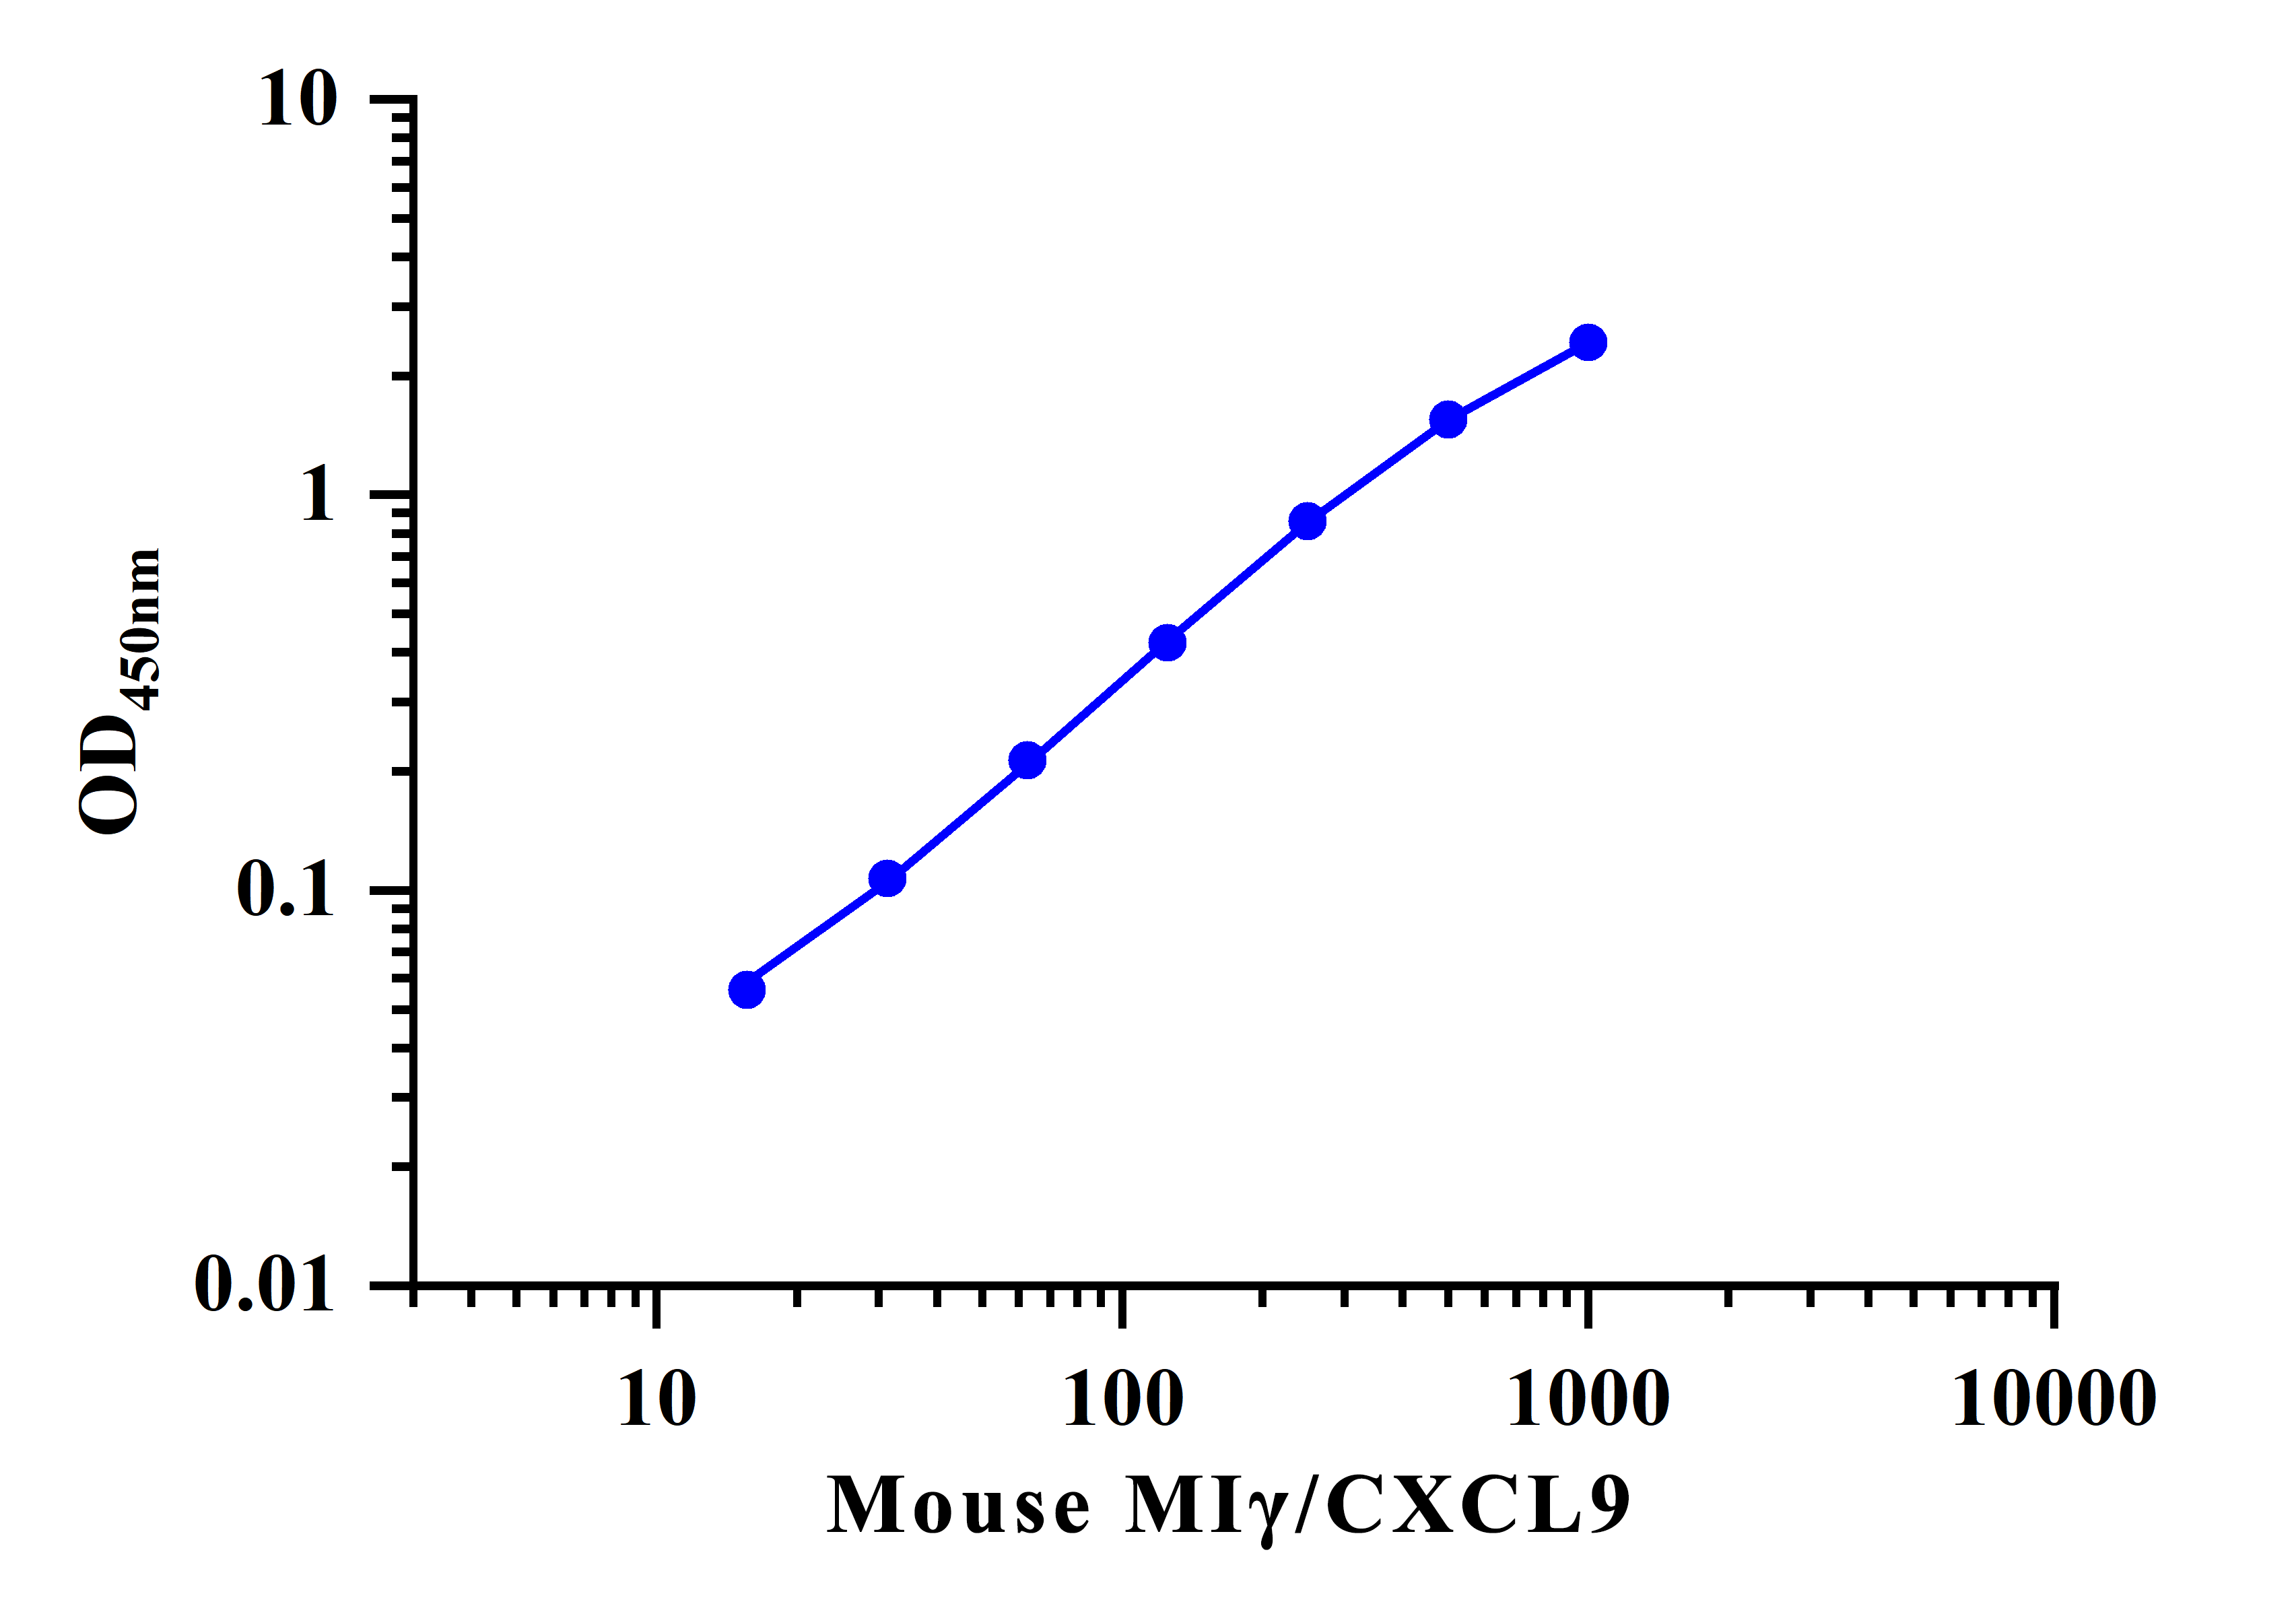
As the OD values of the standard curve may vary according to the conditions of the actual assay performance (e.g. operator, pipetting technique, washing technique or temperature effects), the operator should establish a standard curve for each test. Typical standard curve and data is provided below for reference only.

| Concentration | OD1 | OD2 | Average OD | Corrected |
|---|---|---|---|---|
| 1000 | 2.472 | 2.485 | 2.479 | 2.43 |
| 500 | 1.592 | 1.605 | 1.599 | 1.55 |
| 250 | 0.899 | 0.905 | 0.902 | 0.857 |
| 125 | 0.464 | 0.466 | 0.465 | 0.422 |
| 62.5 | 0.255 | 0.257 | 0.256 | 0.213 |
| 31.25 | 0.149 | 0.149 | 0.149 | 0.107 |
| 15.63 | 0.098 | 0.099 | 0.099 | 0.056 |
| 0 | 0.042 | 0.042 | 0.042 | 0 |
线性
Samples were spiked with high concentrations of target proteins and diluted with Reference Standard & Sample Diluent to produce samples with values within the range of the assay.
| Serum (n=5) | EDTA plasma (n=5) | Cell culture media (n=5) | ||
|---|---|---|---|---|
| 1:2 | Range (%) | 89-97 | 87-101 | 87-105 |
| Average (%) | 95 | 96 | 97 | |
| 1:4 | Range (%) | 85-94 | 87-101 | 80-95 |
| Average (%) | 94 | 99 | 89 | |
| 1:8 | Range (%) | 93-102 | 91-104 | 96-105 |
| Average (%) | 98 | 99 | 100 | |
| 1:16 | Range (%) | 93-106 | 82-94 | 95-102 |
| Average (%) | 104 | 93 | 99 |
精密度
Intra-assay Precision (Precision within an assay): 3 samples with low, mid range and high level were tested 20 times on one plate, respectively. Inter-assay Precision (Precision between assays): 3 samples with low, mid range and high level were tested on 3 different plates, 20 replicates in each plate, respectively.
| Item | Intra-assay Precision | Intra-assay Precision |
|---|---|---|
| Sample | 3 | 3 |
| Replicate | 9 | 18 |
| CV(%) | 5 | 8 |
回收率
The recovery of spiked at three different levels in samples throughout the range of the assay was evaluated in various matrices.
| Sample Type | Range(%) | Average Recovery(%) |
|---|---|---|
| Serum (n=8) | 84-97 | 90 |
| EDTA plasma (n=8) | 80-97 | 88 |
| Cell culture media (n=8) | 80-92 | 85 |
检测流程图

相关文献


 DataSheet
